
TL;DR – The 20 LinkedIn Metrics That Actually Matter

Profile Metrics
Profile Views = Visibility
Search Appearances = Discoverability
Follower Growth Rate = Audience momentum
Social Selling Index (SSI) = Relationship quality
Audience Demographics = Target relevance
Post Metrics
Impressions = Reach
Members Reached = Unique viewers
Profile Views from Post = Interest level
Followers Gained from Post = Value delivery
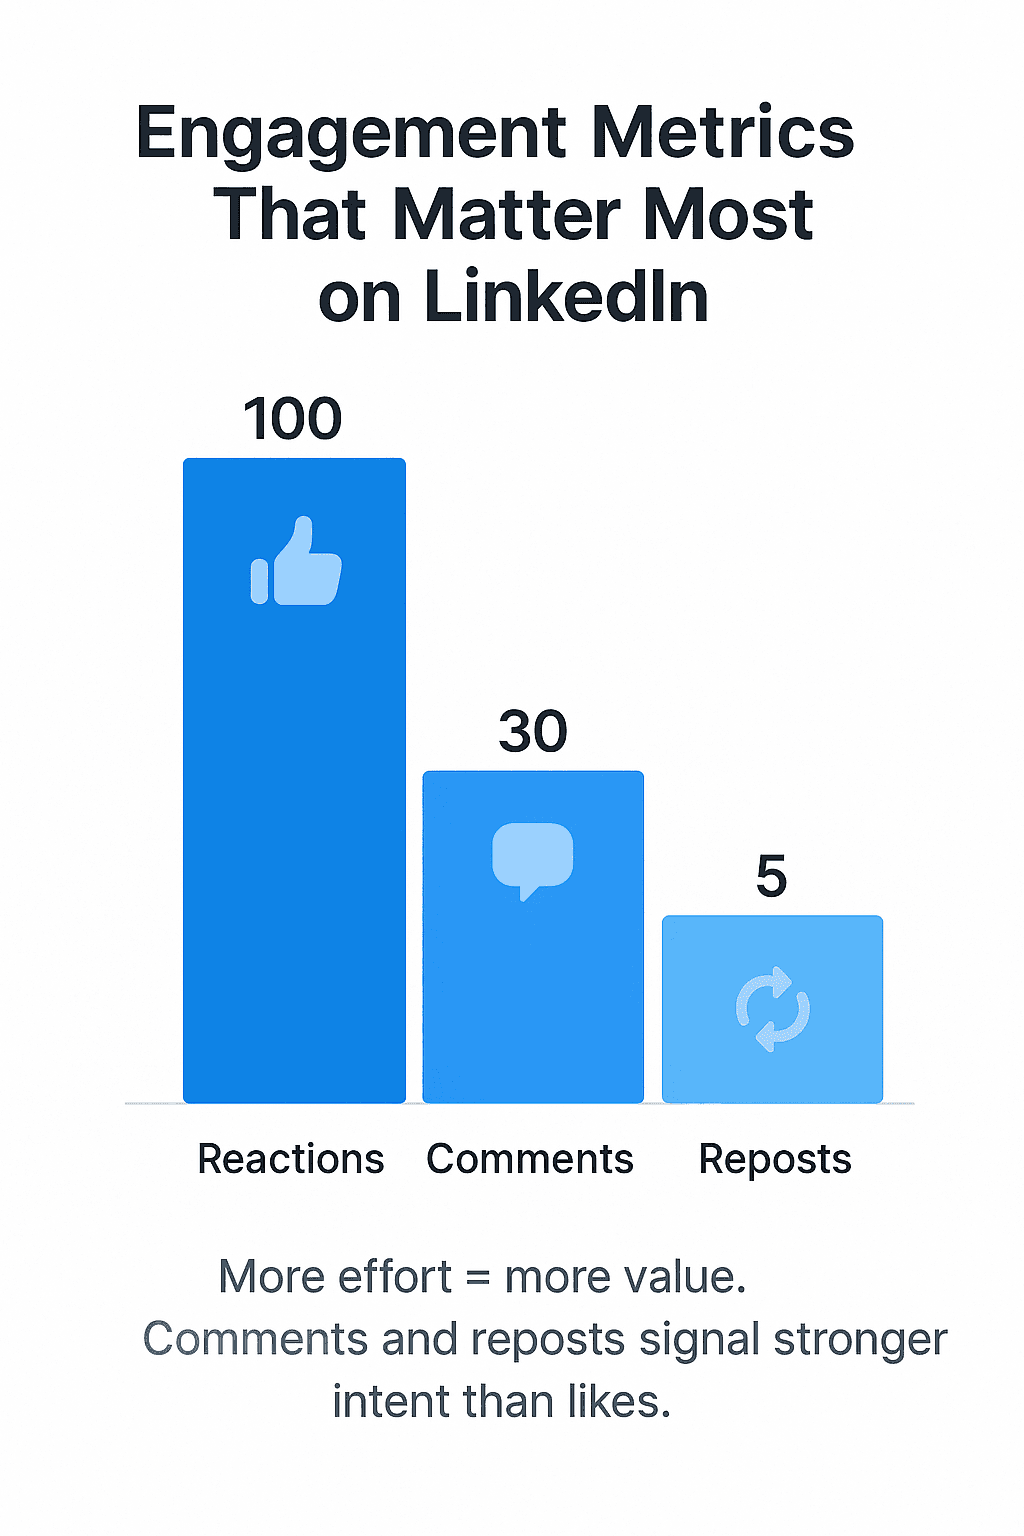
Reactions, Comments, Reposts = Engagement health
Video View Rate = Attention retention
Post Viewer Demographics = Content alignment
Who Viewed Your Profile (from post) = Prospecting signal
Business Metrics
Referral Traffic = Website intent
Leads Generated = Business impact
Conversion Rate = Effectiveness
Cost Per Lead (CPL) = Paid ROI
Overall ROI = Time and money well spent
Category | Metric | What It Measures | Why It Matters |
|---|---|---|---|
Profile Metrics | Profile Views | Visibility of your profile | More views = more inbound interest |
Social Selling Index (SSI) | Relationship-building effectiveness | Higher SSI = more sales opportunities | |
Search Appearances | Discoverability in LinkedIn search | Indicates keyword & profile optimization quality | |
Follower Growth Rate | Audience momentum over time | Tracks real-time brand growth | |
Audience Demographics | Job titles, industries, and seniority of audience | Helps verify if you’re reaching your ideal market | |
Post Metrics | Post Impressions | Total times content appears in feeds | Measures reach and algorithm amplification |
Members Reached | Unique people who saw your content | Reflects actual human reach | |
Profile Viewers from Post | Click-throughs to your profile | Indicates interest generated by content | |
Followers Gained from Post | New followers from a single post | Measures long-term impact of content | |
Reactions | Likes and emotional responses | Baseline engagement signal | |
Comments | Written responses to posts | Signals deeper interest and triggers higher reach | |
Reposts | Shares by others | Multiplies your reach via others’ networks | |
Video View Rate | % of viewers who watched most of your video | Indicates content quality and hook strength | |
Post Viewer Demographics | Who’s actually consuming your content | Helps refine messaging to your ICP | |
Profile Views from Post | Who viewed your profile after seeing your post | Warm leads you can follow up with | |
Business Metrics | Referral Traffic | Website visits from LinkedIn | Tracks demand generation outside the platform |
Leads Generated | Contacts or interest generated from LinkedIn | Proof your content converts viewers into prospects | |
Cost Per Lead (CPL) | Cost of paid acquisition via LinkedIn ads | Evaluates ROI of paid LinkedIn campaigns | |
Conversion Rate | % of visitors who take action | Measures business outcome from LinkedIn efforts | |
ROI | Net gain from time and spend on LinkedIn | Proves whether it’s all worth it |
Tracking these metrics helps you stop guessing, identify what works, and turn your LinkedIn activity into actual business results.
Let's dive in detail.
Your LinkedIn posts are getting likes.
Your connection requests are being accepted.
You're showing up in people's feeds.
But none of that matters if you don't know what's actually driving results.
You post content. You connect with people. You engage with comments.
But when someone asks you, "How's your LinkedIn content strategy performing?" you probably give a vague answer like "Pretty good, I think."
This is because most people focus on vanity metrics like total followers or post likes.
But here's the reality: those numbers don't pay your bills or land you that dream job. The professionals who are crushing it on LinkedIn track completely different metrics – metrics that actually correlate with business results.
I'm talking about metrics like Social Selling Index scores that predict revenue generation. Profile view patterns that reveal whether you're attracting your ideal audience. Conversion rates that show if your content actually drives business outcomes.
The good news? You don't need to be a data scientist to track these metrics. LinkedIn gives you access to incredibly detailed analytics – you just need to know where to look and what to measure.
In this guide, I'm going to show you exactly which 20 metrics separate the LinkedIn winners from the wannabes.
What are LinkedIn Metrics?
LinkedIn metrics are measurable data points that show you exactly how your profile and content are performing on the platform.
These metrics are widely referenced across LinkedIn’s Sales Navigator guides and B2B content strategy playbooks [LinkedIn Sales Solutions].
They tell you who's viewing your profile, how your posts are reaching people, which content resonates with your audience, and ultimately, whether your LinkedIn activities are translating into real business results.
You've got three main categories of LinkedIn metrics to pay attention to:
Profile Metrics
Post Metrics
Business Metrics
The beauty of LinkedIn metrics is that they're not just vanity numbers.
Every metric you track should connect back to a specific goal – whether that's landing your next job, closing more sales, or establishing yourself as a thought leader in your industry.
Why is Tracking LinkedIn Metrics Important?
Here’s some brutal truth: I've seen talented professionals spend months creating content, networking, and building their presence, only to realize they've been targeting the wrong audience the entire time.
I've watched sales teams invest countless hours on LinkedIn without knowing which activities actually generate leads. Don't let that be you.
In fact, a study by LinkedIn shows that 78% of social sellers outsell peers who don’t use social media.
Tracking LinkedIn metrics isn't just about satisfying your inner data nerd — it's the foundation of a high-performing content strategy. Even LinkedIn’s own research emphasizes that strategic analytics drive significantly better B2B outcomes [LinkedIn Marketing Blog].
Let me break down exactly why tracking these metrics will transform your LinkedIn game:
Stop guessing. Start growing.
Without metrics, you're just guessing.
You might believe long posts work better than short ones — but unless you're tracking results, you can’t be sure.
Track what’s worth your time.
Your time is valuable. If you're spending an hour each day on LinkedIn, you deserve to know whether that hour is generating results. Metrics show you which activities give you the biggest return on investment, so you can focus your energy where it matters most.
Spot what resonates with your audience.
Not all content is created equal. Some posts will flop, others will go viral, and most will fall somewhere in between. By tracking metrics, you'll start to see patterns in what your audience loves, allowing you to create more content that hits the mark.
Catch problems early.
Metrics act as an early warning system. If your profile views suddenly drop, you'll know to investigate. If your engagement rates are declining, you can adjust your strategy before you lose momentum. Problems are much easier to fix when you catch them early.
Prove ROI with real numbers.
Whether you're reporting to a boss, investors, or clients, metrics provide concrete proof that your LinkedIn efforts are paying off. Instead of saying "I think our LinkedIn strategy is working," you can show exactly how it's contributing to lead generation, brand awareness, or recruitment goals.
Double down on what works.
Once you identify your highest-performing content types, posting times, and engagement strategies, you can systematically scale those approaches. This is how professionals go from sporadic LinkedIn users to influential thought leaders who consistently generate opportunities.
The bottom line? LinkedIn metrics are your roadmap to professional success on the platform. Without them, you're driving blind. With them, you're making informed decisions that compound over time and deliver measurable results.
Now that you understand why tracking matters, let's dive into the specific metrics that will make the biggest difference for your LinkedIn success.
20 LinkedIn Metrics to Track to Analyze Your Performance
Here's where the rubber meets the road.
These 20 metrics will give you the clarity you need to grow on LinkedIn. I've organized them into three categories that mirror the customer journey – from discovery to engagement to conversion.
Let's start with the foundation: your profile metrics.
LinkedIn Profile Metrics
Your LinkedIn profile is your digital storefront. Just like a physical store, you need to know how many people are walking by, coming inside, and ultimately becoming customers.
These five profile metrics tell you exactly that.
1 - Profile Views
Profile views are the heartbeat of your LinkedIn presence.
This metric shows you how many people have looked at your profile over a specific time period, giving you a direct measure of your professional visibility and reach.
More views typically mean more opportunities – whether that's job offers, partnership requests, speaking engagements, or sales prospects. When someone views your profile, they're showing genuine interest in you and what you do.
Here's what makes profile views so valuable: they're often the first step in any professional relationship. Before someone connects with you, messages you, or does business with you, they usually check out your profile first. So tracking this metric helps you understand how effectively you're attracting attention.
You want to pay attention to both the total number of views and the trends over time. A sudden spike in views might indicate that a piece of content went viral or that you appeared in search results for a trending topic. A steady decline could signal that your content strategy needs refreshing or that your LinkedIn profile optimization needs work.
What constitutes a good number of profile views? For most professionals, getting 50-100 profile views per week is solid. If you're actively posting content and engaging regularly, you should aim for 100-300 views per week.
According to data from Kinsta, the average LinkedIn user gets around 40 profile views per month, but active creators see 5–10x more depending on content quality and engagement.
If your profile views are lower than you'd like, focus on creating more engaging content, participating in relevant conversations, and optimizing your profile for your target keywords.
2 - SSI (Social Selling Index)
Your Social Selling Index is LinkedIn's way of scoring how effectively you're building professional relationships and leveraging social networks for business outcomes.
This score ranges from 0 to 100 and measures four key areas:
Establishing your professional brand
Finding the right people
Engaging with insights
Building relationships
SSI isn’t just a nice number — it actually predicts success. Research shows that people with high SSI scores generate 45% more opportunities and are 51% more likely to hit sales targets.
Even if you're not in sales, a high SSI score indicates that you're using LinkedIn strategically to build meaningful professional relationships.
Most LinkedIn users have SSI scores between 40-60. If you're below 40, you're likely not using LinkedIn to its full potential. Scores between 60-75 indicate strong social selling skills, while anything above 75 puts you in the top tier of LinkedIn users.
To increase your Social Selling Index, focus on completing your profile with relevant keywords, sharing valuable industry content, engaging meaningfully with others' posts, and sending personalized connection requests.
More importantly, you should check your SSI score monthly at LinkedIn's Sales Navigator or through the SSI dashboard.
3 - Search Appearances
Search appearances tell you how often your profile shows up in LinkedIn search results.
This metric is crucial because it measures your discoverability – how easy it is for potential connections, employers, or clients to find you when they're looking for someone with your skills or experience.
When someone searches for terms related to your industry, role, or expertise, you want your profile to appear in those results. Search appearances directly correlate with profile views and connection requests, making this a leading indicator of your LinkedIn growth potential.
LinkedIn search works differently from Google. The algorithm considers factors like keyword optimization in your profile, your activity level, your connection relevance to the searcher, and how recently you've been active on the platform. If you're not appearing in searches, you're missing out on organic discovery opportunities.
To boost search appearances, you can optimize your headline and summary with relevant keywords, keep your profile updated with current roles and skills, and maintain regular activity on the platform.
The more LinkedIn's algorithm sees you as relevant and active, the more likely you'll appear in search results.
4 - Follower Growth Rate
Your follower growth rate measures how quickly your LinkedIn network is expanding over time.
Unlike total followers (which is just a snapshot), the growth rate shows momentum and trajectory. A healthy growth rate indicates that your content and professional brand are resonating with your target audience.
Followers on LinkedIn represent people who want to stay updated with your professional insights and activities. They're essentially subscribers to your professional newsletter.
When your follower count grows consistently, it signals that you're building influence and authority in your field.
The key is to focus on quality growth, not just numbers. Rapid follower growth from irrelevant audiences won't help your professional goals. You want followers who are in your industry, potential clients, or people who can advance your career objectives.
If you're posting regularly and engaging authentically, aim for 5-10% monthly growth.
Most casual LinkedIn users see <2% monthly growth, but active creators can achieve up to 15–20% growth when posting 3–5 times/week.
If your follower growth has stagnated, experiment with different content types, engage more actively with others in your industry, or consider collaborating with other professionals to tap into their networks.
5 - Audience Demographics
Understanding who your LinkedIn audience is can make or break your content strategy.
Audience demographics show you the job titles, industries, locations, and seniority levels of the people following you and engaging with your content.
This data shows if you're reaching the right people — like decision-makers in your industry, not random connections.
LinkedIn provides detailed demographic breakdowns including job functions, industries, seniority levels, company sizes, and geographic locations. You can see which companies your followers work for, what their roles are, and how senior they are in their organizations.
For example, if you want to attract C-level executives but your audience skews toward individual contributors, you might need to adjust your content topics and tone. If you're targeting the US market but most of your followers are international, consider whether your content resonates with a global audience.
The beauty of these profile metrics is that they work together to paint a complete picture of your LinkedIn effectiveness.
High-profile views with strong search appearances indicate good discoverability. Growing followers with the right demographics shows you're building influence with your target audience. And a strong SSI score confirms you're using the platform strategically for relationship building.
LinkedIn Post Metrics
Now let's talk about the metrics that really matter for your content strategy. While profile metrics show how discoverable you are, post metrics reveal how effectively you're engaging your audience and building relationships through content.
These are the numbers that separate casual LinkedIn users from content creators who consistently generate opportunities through their posts.
6 - Post Impressions
Post impressions tell you how many times your content appeared in someone's LinkedIn feed, regardless of whether they engaged with it or not.
According to LinkedIn Help documentation, impressions are counted every time a post is loaded in someone's feed, regardless of engagement [LinkedIn Help Center].
Every impression represents someone who could have read your post, clicked on your profile, or taken action based on your content. Higher impressions typically lead to more engagement, profile views, and business opportunities.
What makes impressions particularly valuable is that they show you how LinkedIn's algorithm is treating your content.
If your impressions are consistently low despite having a decent follower count, it might indicate that your content isn't resonating with your audience or that you're posting at suboptimal times.
For most professionals, getting 500-2000 impressions per post is solid performance. If you have 1000+ followers and you're getting fewer than 300 impressions per post, that's a red flag that your content strategy needs work.
To boost impressions, you need to create content that encourages early engagement and focus on posting when your audience is most active.
The more people interact with your post in the first hour, the more LinkedIn will show it to others.
7 - Members Reached
Members reached shows you the unique number of people who actually saw your post, which is different from impressions.
While impressions count every time your post appears in someone's feed, members reached count each person only once, even if they saw your post multiple times.
This metric gives you a clearer picture of your actual audience size for each piece of content. It's particularly useful for understanding the effectiveness of your content distribution and whether you're reaching new people or just the same audience repeatedly.
The ratio between members reached and impressions tells an interesting story. Suppose you have significantly more impressions than members reached. In that case, it means people are seeing your content multiple times – either because LinkedIn's algorithm is showing it repeatedly or because it's being shared and reshared.
Members reached also helps you understand your content's viral coefficient. If your members reached number is much higher than your follower count, it means your content is being shown to people outside your immediate network – a sign that LinkedIn's algorithm considers your content valuable.
For most professionals, reaching 300-1500 unique members per post is good performance. If you're consistently reaching fewer than 200 unique members despite having hundreds of followers, you might need to improve your content quality or posting strategy.
8 - Profile Viewers from Post
This metric shows you how many people viewed your profile after seeing a specific post.
It's one of the most valuable metrics for measuring content effectiveness because it indicates that your post was compelling enough to make someone want to learn more about you.
Profile viewers from the post is a leading indicator of business opportunities. When someone clicks through to your profile after reading your content, they're showing serious interest in who you are and what you do. These are often your warmest prospects for networking, partnerships, or business deals.
This metric helps you identify your highest-performing content types. Posts that drive significant profile views are usually educational, thought-provoking, or showcase your expertise in a way that makes people curious about your background and experience.
A good benchmark is getting 10-50 profile viewers per post, depending on your reach and content quality. If you're getting fewer than 5 profile viewers per post, your content might not be compelling enough or clearly connected to your professional expertise.
To increase profile viewers from posts, make sure your content clearly establishes your expertise, includes a clear value proposition, and gives people a reason to want to connect with you.
Most importantly, you need to end posts with calls to action that encourage people to check out your profile or connect with you.
9 - Followers Gained from Post
Tracking followers gained from individual posts shows you which content is most effective at growing your audience.
This metric reveals what type of content makes people want to subscribe to your future updates.
Followers gained from a post is particularly valuable because these are highly qualified followers – people who discovered you through your content and made an active decision to follow you based on the value you provided. They're more likely to engage with your future content and become genuine professional connections.
Different types of content attract followers at different rates. Educational content, industry insights, and personal stories about professional challenges tend to attract more followers than generic motivational posts or company updates.
This metric also helps you understand your content's long-term value. A post might not get massive engagement on the day you publish it, but if it continues to attract followers weeks or months later, it's providing sustained value to your professional brand.
To maximize followers gained from posts, consider creating content that showcases your unique expertise, provides actionable insights your audience can use, and clearly demonstrates the value of following you for future content.
10 - Reactions
Reactions are the most basic form of engagement on LinkedIn, but they're far from meaningless.
They show immediate audience response to your content and are often the first step in building deeper professional relationships.
LinkedIn offers six reaction types: Like, Celebrate, Love, Insightful, Funny, and Support.
Each reaction tells you something different about how your content resonated. Insightful reactions often indicate that you shared valuable industry knowledge. Celebratory reactions suggest your audience appreciates your achievements or good news. Support reactions show empathy and solidarity.
The total number of reactions gives you a quick gauge of content performance, but pay attention to the types of reactions, too.
Content that gets mostly "Insightful" reactions is probably educational and valuable. Posts with lots of "Celebrate" reactions might be great for building relationships, but less effective for demonstrating expertise.
Reactions also boost your content's visibility in LinkedIn's algorithm. Posts with high early reaction rates are more likely to be shown to a broader audience, creating a positive feedback loop for successful content.
To increase reactions, you can create content that evokes emotion, asks questions, or shares insights that make people think, "this is worth acknowledging."
Posts that celebrate others, share valuable tips, or provide unique industry perspectives tend to generate more reactions.
11 - Comments
Comments represent the highest-quality engagement on LinkedIn because they require the most effort from your audience.
When someone takes time to write a thoughtful comment, they're genuinely interested in your content and want to start a conversation.
Comments are incredibly valuable for building professional relationships. Each comment is an opportunity to engage one-on-one with potential clients, partners, or collaborators. The conversations that happen in your comments section often lead to private messages, connection requests, and business opportunities.
Comments also significantly boost your content's reach. LinkedIn's algorithm considers comments as strong signals that your content is valuable and worth showing to more people.
Posts with active comment sections often achieve much higher impression counts.
To generate more comments, you should ask specific questions in your posts, share controversial (but professional) opinions, or create content that invites others to share their experiences.
Most importantly, you must always respond to comments promptly and thoughtfully to encourage more engagement.
12 - Reposts
Reposts (shares) are the ultimate content complement.
When someone reposts your content, they're essentially endorsing it to their entire network and putting their professional reputation behind your insights.
Reposts dramatically amplify your reach because they expose your content to entirely new audiences. Each repost has the potential to introduce you to hundreds or thousands of new professionals who might never have discovered you otherwise.
The people who repost your content often become your biggest advocates and can lead to speaking opportunities, partnerships, or business deals.
This is why you should pay attention to who's reposting your content, because these are often your most engaged audience members and potential collaboration partners.
Reposts are relatively rare compared to other engagement types. Getting 5-20 reposts on a single post is excellent performance for most professionals. If your content consistently gets reposted, you're creating genuinely valuable content that others want to associate with.
To encourage more reposts, you can create content that makes others look knowledgeable when they share it, provide unique insights that aren't available elsewhere, and make your posts easy to share by including clear key takeaways.
13 - Video View Rate
With video content becoming increasingly popular on LinkedIn, tracking video view rates helps you understand how effectively your video content captures and holds attention.
This metric shows what percentage of people who started watching your video actually watched a significant portion of it.
Video view rate is crucial because it indicates content quality and audience interest. A high view rate means your video content is compelling enough to hold people's attention in a fast-scrolling social media environment.
LinkedIn considers various view durations when calculating engagement, but generally, a view counts when someone watches for at least 3 seconds.
However, the real value comes from longer view durations – people who watch 50% or more of your video are highly engaged and likely to remember your message.
LinkedIn considers a video view valid after 3 seconds, but best-performing videos retain attention for at least 10+ seconds, especially when they open with a hook or question.
Good video view rates on LinkedIn typically range from 25-60%, depending on video length and content quality. Short videos (under 60 seconds) often achieve higher view rates than longer content.
To improve video view rates, I recommend starting with a compelling hook in the first 3 seconds, using captions for accessibility, keeping videos concise and focused, and including a clear value proposition that gives viewers a reason to keep watching.
14 - Post Viewers Demographics
Understanding who's viewing your posts helps you determine whether your content is reaching your target audience.
Post viewers' demographics show you the job titles, industries, and seniority levels of people engaging with your specific content.
This data is invaluable for content strategy optimization. If you're trying to attract C-level executives but your post viewers are primarily entry-level professionals, you might need to adjust your content topics, tone, or posting times.
Post viewer demographics also help you identify content gaps and opportunities. If you notice that certain industries or job functions are highly engaged with your content, you might want to create more content specifically for those audiences.
The goal is to see post viewer demographics that align with your professional objectives.
If you're in sales, you want decision-makers viewing your content. If you're job hunting, you want recruiters and hiring managers in your audience.
15 - Who's Viewed Your Profile Since the Post
This metric shows you the specific individuals who viewed your profile after seeing a particular post.
These profile viewers are often your highest-quality prospects because they've taken an active step beyond consuming your content – they want to understand your background, experience, and how they might work with you.
Tracking who views your profile after specific posts helps you identify which content topics generate the most business interest. Posts about industry trends might attract fellow professionals, while posts about your services might draw potential clients.
This information is actionable gold. You can reach out to these profile viewers with personalized messages referencing the post that brought them to your profile. This creates a natural conversation starter and significantly higher response rates than cold outreach.
These post metrics work together to give you a complete picture of your content performance.
High impressions and reach show your content is being distributed effectively. Strong engagement (reactions, comments, and reposts) indicates your content resonates with your audience. And profile views plus followers gained from posts show your content is driving real business interest and relationship-building opportunities.
Business Metrics
Now we get to the metrics that actually matter for your bottom line.
These are the numbers that prove whether your LinkedIn strategy is generating real business results or just keeping you busy.
While profile and post metrics show you how well you're building your presence, business metrics reveal whether that presence is translating into leads, sales, and revenue.
These are the metrics that separate LinkedIn hobbyists from professionals who use the platform strategically to grow their business.
16 - Referral Traffic
Referral traffic measures how many people click through from LinkedIn to your website, landing pages, or other external content.
This metric bridges the gap between your LinkedIn presence and your business outcomes by showing how effectively you're driving people to take action outside the platform.
LinkedIn referral traffic is particularly valuable because it comes from a professional context. People clicking through from LinkedIn are usually in a business mindset, making them more likely to engage with your offerings, sign up for your services, or make purchasing decisions.
LinkedIn drives over 80% of B2B social media leads, making it the dominant platform for professional referral traffic.
You can track LinkedIn referral traffic through Google Analytics, your website analytics platform, or specialized link tracking tools.
To increase referral traffic, you should consider including clear calls-to-action in your posts and sharing valuable content that gives people a reason to visit your website.
Furthermore, you should optimize your profile with relevant links and create LinkedIn-specific landing pages that continue the conversation you started on the platform.
17 - Leads Generated
Leads generated from LinkedIn show you how many qualified prospects you're attracting through your LinkedIn activities.
A study by HubSpot found that LinkedIn is 277% more effective for lead generation than Facebook and Twitter combined.
This metric goes beyond traffic to measure people who've shown genuine interest in your business by providing their contact information or expressing intent to purchase.
LinkedIn leads are often higher quality than leads from other channels because they come from a professional networking context. People who connect with you or message you about your services are usually serious about business relationships, not just casual browsers.
There are several ways to generate and track leads from LinkedIn.
Direct messages requesting your services, connection requests from potential clients, website form submissions from LinkedIn referral traffic, and sign-ups for your newsletters or resources after discovering you on LinkedIn all count as leads.
The key is to have systems in place to capture and nurture these leads.
This might include lead magnets linked in your profile, contact forms on your website, or simply a process for following up with people who engage with your content.
To increase lead generation, I recommend creating content that addresses specific pain points your ideal clients face, using your profile as a lead generation tool with clear value propositions, engaging authentically with potential prospects' content, and always following up on warm connections with personalized messages.
These lead generation metrics are widely validated in LinkedIn’s case studies, particularly for high-ticket B2B and service-based businesses [LinkedIn Business Case Studies].
18 - Cost Per Lead (For Paid Campaigns)
Cost per lead measures how much you're spending to generate each qualified prospect through LinkedIn's paid advertising options.
This metric is crucial for anyone using LinkedIn Ads, Sponsored Content, or other paid promotion strategies to grow their business.
LinkedIn's advertising platform offers unique targeting options that can't be found on other social platforms. You can target by job title, company size, industry, seniority level, and even specific companies.
This precision targeting often justifies higher costs per lead compared to other advertising channels.
Furthermore, understanding your cost per lead helps you evaluate the effectiveness of your paid LinkedIn campaigns and compare them to other marketing channels.
If your LinkedIn cost per lead is significantly higher than other channels but the leads close at a higher rate, the higher cost might be justified.
The key is to track not just the cost per lead, but the quality and conversion rate of those leads. A $200 cost per lead that converts at 25% is more valuable than a $50 cost per lead that converts at 2%.
To optimize your cost per lead, you can test different targeting options to find your ideal audience, create compelling ad copy that speaks directly to your target market's pain points, use relevant landing pages that match your ad messaging, and continuously optimize your campaigns based on performance data.
19 - Conversion Rate
Conversion rate measures the percentage of your LinkedIn visitors or leads who take a desired action, such as making a purchase, scheduling a consultation, or signing up for your services.
This shows if your LinkedIn efforts are turning into real results.
LinkedIn conversion rates are typically higher than other social media platforms because the audience is professionally motivated and often has buying authority.
According to data compiled by HubSpot, LinkedIn has an average visitor-to-lead conversion rate of 2.74%, the highest among major social platforms.
People who find you through LinkedIn are usually researching solutions for business problems, not just browsing casually.
The quality of your LinkedIn content and profile directly impacts conversion rates. If your content establishes expertise and trust, visitors are more likely to convert. If your profile clearly communicates your value proposition, people are more likely to take action.
To improve conversion rates, ensure your LinkedIn content aligns with your website messaging, create LinkedIn-specific landing pages that continue the professional conversation, use social proof and testimonials to build trust, and follow up promptly with leads who've shown interest.
20 - Return on Investment (ROI)
ROI is the ultimate business metric that shows whether your LinkedIn strategy is generating more revenue than it costs.
This metric takes into account both your time investment and any paid advertising costs, comparing them to the actual revenue generated from LinkedIn activities.
Calculating LinkedIn ROI requires tracking revenue generated from LinkedIn leads, factoring in the time you spend on content creation and engagement.
This includes any advertising costs or tool subscriptions, and measuring the results over a meaningful time period since LinkedIn relationship building often has longer sales cycles.
LinkedIn ROI is often higher than other marketing channels because of the platform's professional context and relationship-building nature. This claim is supported by multiple industry reports, including HubSpot’s annual State of Marketing report and LinkedIn’s own conversion benchmarks [HubSpot | LinkedIn Business].
While it might take longer to see results, the customers you acquire through LinkedIn often have higher lifetime values and lower churn rates.
To maximize LinkedIn ROI, you need to focus on attracting high-value prospects rather than just increasing follower counts, build genuine relationships that lead to long-term business partnerships, create content that directly addresses your target market's business challenges, and maintain consistent activity to build momentum over time.
How to Check LinkedIn Profile Analytics
Now that you know which metrics matter, let's get into the practical stuff. LinkedIn makes it surprisingly easy to access your analytics, but many people don't know where to look or what to do with the data once they find it.
Here's your step-by-step guide to finding and interpreting your LinkedIn profile analytics.
How to Access Your LinkedIn Analytics Dashboard
First things first – you need to know where to find your analytics.
LinkedIn has made this more accessible over the years, but it's still not immediately obvious to most users.
Step 1: Navigate to Your Profile
Click on your profile picture in the top navigation bar and select "View Profile" from the dropdown menu. This takes you to your public profile page, where others see your information.
Step 2: Access Your Analytics
Once you're on your profile page, look for the "Analytics" section. You'll see this in the left sidebar under your profile summary. Click on "Analytics" to open your dashboard.
Step 3: Explore the Dashboard
LinkedIn's analytics dashboard is divided into several sections. The main areas you'll want to focus on are profile views, search appearances, and post analytics. Each section gives you different insights into your LinkedIn performance.
How to Find Your Profile Views Data
Profile views are one of the most important metrics for understanding your LinkedIn reach. Here's how to find and interpret this data:
Locate the Profile Views Section
In your analytics dashboard, you'll see a section called "Profile Views" with a graph showing your views over time. This typically displays the last 90 days of data by default.
Understand the Graph
The graph shows daily profile views, allowing you to spot trends and spikes in activity. Look for patterns like increased views after posting content, attending events, or being mentioned by others.
Analyze Who's Viewing Your Profile
Below the graph, you'll see data about who's viewing your profile. This includes information about their job titles, industries, companies, and locations. This demographic data is crucial for understanding whether you're attracting your target audience.
Track View Sources
LinkedIn also shows you how people found your profile. Common sources include LinkedIn search, your posts, connections' activity, and external sources. Understanding these sources helps you optimize your discoverability strategy.
How to Check LinkedIn Post Analytics
Your profile analytics give you the big picture, but post analytics show you exactly which content is driving results.
LinkedIn's post analytics have become much more detailed over the years, giving you insights that can transform your content strategy.
Here's how to access and use this data effectively.
How to Access Individual Post Analytics in LinkedIn
Every post you publish on LinkedIn comes with its own analytics dashboard.
Here's how to find and navigate this data:
Step 1: Navigate to Your Posts
Go to your LinkedIn profile and scroll down to the "Activity" section. Click "Show all activity" to see your recent posts. Alternatively, you can access posts directly from your LinkedIn homepage by clicking on your profile picture and selecting "Posts & Activity."
Step 2: Open Post Analytics
For each post, you'll see a small analytics icon (usually looks like a bar chart) in the bottom right corner of the post. Click this icon to open the detailed analytics for that specific post.
Step 3: Explore the Analytics Dashboard
Each post's analytics dashboard shows multiple metrics, including impressions, clicks, reactions, comments, and shares. You'll also see demographic data about who engaged with your post.
How to Analyze LinkedIn Video Content Performance
Video posts get additional analytics that are crucial for understanding video performance:
View Duration and Completion Rates
For video posts, you'll see average view duration and what percentage of viewers watched to completion. This data helps you understand if your videos are holding attention or if people are dropping off early.
View Rate by Timeline
LinkedIn shows you a timeline of when people stopped watching your video. If you notice a significant drop-off at a specific point, you can analyze what happened at that moment and adjust future videos accordingly.
Audience Retention Insights
Video analytics also show you which parts of your video had the highest and lowest retention. This helps you understand what content keeps people engaged and what causes them to scroll away.
Boost Your LinkedIn Growth with Supergrow!
Now that you understand which metrics matter and how to track them, you might be wondering: "How do I actually use this data to grow faster on LinkedIn?"
While LinkedIn's native analytics give you the data, turning that data into consistent growth takes time, strategy, and often some additional tools.
That's where Supergrow comes in.
Supergrow isn't just another LinkedIn tool – it's a complete LinkedIn growth system designed specifically for professionals who want to turn their LinkedIn presence into a business asset.
Ready to turn your LinkedIn analytics into actual growth?
Visit supergrow.ai and sign up for a free 7-day trial today.
FAQs
1) What are metrics in LinkedIn?
LinkedIn metrics are measurable data points that show how your profile and content perform on the platform. They include profile views, post impressions, engagement rates, follower growth, and business outcomes like leads generated. Unlike other social platforms focused on entertainment, LinkedIn metrics measure professional outcomes that actually matter for your career and business growth.
2) How to view LinkedIn metrics?
Access your LinkedIn metrics through these simple steps:
Profile Analytics: Go to your profile → Click "Analytics" in the left sidebar
Post Analytics: Find any post → Click the analytics icon (bar chart) in the bottom right
Social Selling Index: Search "LinkedIn Social Selling Index" or access via Sales Navigator
Advanced Analytics: Available with LinkedIn Premium for more detailed insights
3) What are KPIs for LinkedIn?
LinkedIn KPIs depend on your goals:
Brand Building: Profile views, follower growth rate, Social Selling Index score
Lead Generation: Profile viewers from posts, connection requests, and referral traffic
Thought Leadership: Post engagement rates, comments, shares, industry mentions
Sales: Conversion rates, cost per lead, revenue from LinkedIn connections
Job Searching: Recruiter profile views, hiring manager connections, interview requests
4) What's a good engagement rate on LinkedIn?
LinkedIn engagement rates are typically higher than other social platforms:
Average: 2-5% engagement rate
Good: 5-8% engagement rate
Excellent: 8%+ engagement rate
Engagement rate = (reactions + comments + shares + clicks) ÷ total impressions
According to Hootsuite, the median LinkedIn engagement rate across industries is 3.16%, with tech and consulting seeing the highest rates.

Related Articles


Turn expert thinking into strategic LinkedIn® visibility that drives influence and revenue.
© 2026 Supergrow. All rights reserved.
LinkedIn is the registered trademark of LinkedIn Corporation or its affiliates. The use of the LinkedIn trademark in connection with this product does not signify any affiliation with or endorsement by LinkedIn Corporation or its affiliates.