
65% of employee advocacy program managers say measuring ROI is their biggest challenge.
Not getting employees to post. Not content quality. Not tool adoption. Proving that the program is worth the budget it consumes.
Most B2B teams launch with participation goals, not revenue goals. When the CMO asks about the pipeline or the CFO asks about cost efficiency at the quarterly review, the program manager has only a spreadsheet of impressions.
The measurement was never built to answer the questions leadership actually asks.
Employee advocacy ROI is measurable. It requires the right metrics, set up before the first post goes live, and a clear framework for presenting different data to different stakeholders. This article gives you both.
Why Most Employee Advocacy Programs Cannot Prove ROI
The ROI problem is not a data problem. It is a design problem — built into the program before the first post ever went live. Most teams track what is easy to collect and then try to retrofit a business case when leadership asks a question the data was never set up to answer.
The Wrong Metrics Are Set at Launch
Teams collect shares, impressions, and likes because they are easy to pull. Not because they answer anything leadership actually cares about.
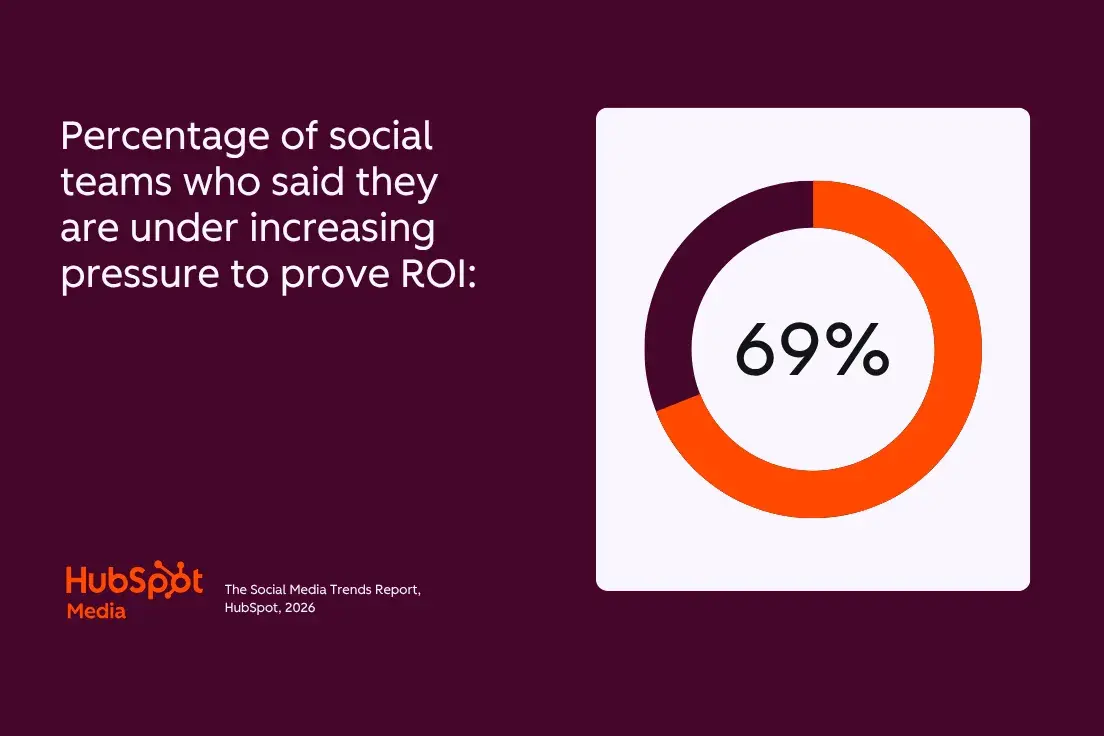
HubSpot's Report found that 41% of B2B marketers say it is hard to tie social activity to business outcomes. And 69% of social teams are under increasing pressure to prove ROI. The measurement problem starts before the program launches — not at the quarterly review.
Claire Kennedy, Social Media and Advocacy Manager at Forrester Research, addressed this directly on the B2B Better podcast: "building credibility with leadership from the start is the single most important factor in sustaining an advocacy program over the long term."
Before the first post goes live, three things need to be in place:
- UTM parameters on all advocacy content — connecting LinkedIn activity to CRM pipeline
- A custom "Employee Advocacy Source" CRM field tagging every lead where an advocacy touchpoint appeared
- A baseline record of paid LinkedIn CPC at the $5-8 industry average as the CFO comparison benchmark
Without these three in place, the quarterly review becomes a guessing exercise.
If you want to understand the structural gaps that kill programs before they ever reach the measurement conversation, our employee advocacy challenges guide covers them in detail.
The CMO and CFO Ask Different Questions
Most program managers walk into a leadership review with one set of numbers and two very different audiences.
The CMO wants to know if the program is building pipeline and brand presence.
The CFO wants to know the cost per result compared with paid alternatives on LinkedIn.
These are fundamentally different questions, and most programs prepare data that answers neither.
The CMO Survey Spring found that CFO pressure on marketing ROI increased 52% from 2023 to 2025. CEO pressure increased 20% in the same period. Leadership is not getting less demanding. The bar for proving program value is rising every quarter.
The programs that survive budget reviews are not the ones with the most impressive impression counts. They are the ones where the program manager walked in with the right number for the right stakeholder. That starts with knowing which metrics belong in which conversation before you schedule the meeting.
How to Measure Employee Advocacy ROI: A Six-Metric Framework Your Leadership Will Trust
These six metrics answer every question leadership asks about program value from the CMO's pipeline question to the CFO's cost-efficiency question. Each one has a calculation method, a benchmark to compare against, and a specific stakeholder conversation it closes.
1. Participation Rate
Participation rate is the leading indicator of program health.
Before EMV compounds, before pipeline attribution builds, before any ROI number becomes defensible, participation rate tells you whether the program is actually running or quietly dying.
Most program managers discover a participation problem at the quarterly review. By then, it is too late to course correct before leadership asks for results. Tracking it weekly gives you the window to intervene before the drop becomes a pattern.
How to calculate: (Employees who posted at least once that week ÷ total enrolled employees) × 100
A healthy B2B advocacy program targets 40-60% weekly active participation. Below 30% signals a program design problem. Either employees don't see the personal value, the content starting point is missing, or leadership isn't modeling participation for the rest of the team.
Supergrow's employee advocacy analytics dashboard automatically tracks participation rates for every enrolled member updated in real time, with a weekly Monday report delivered to Slack or email.
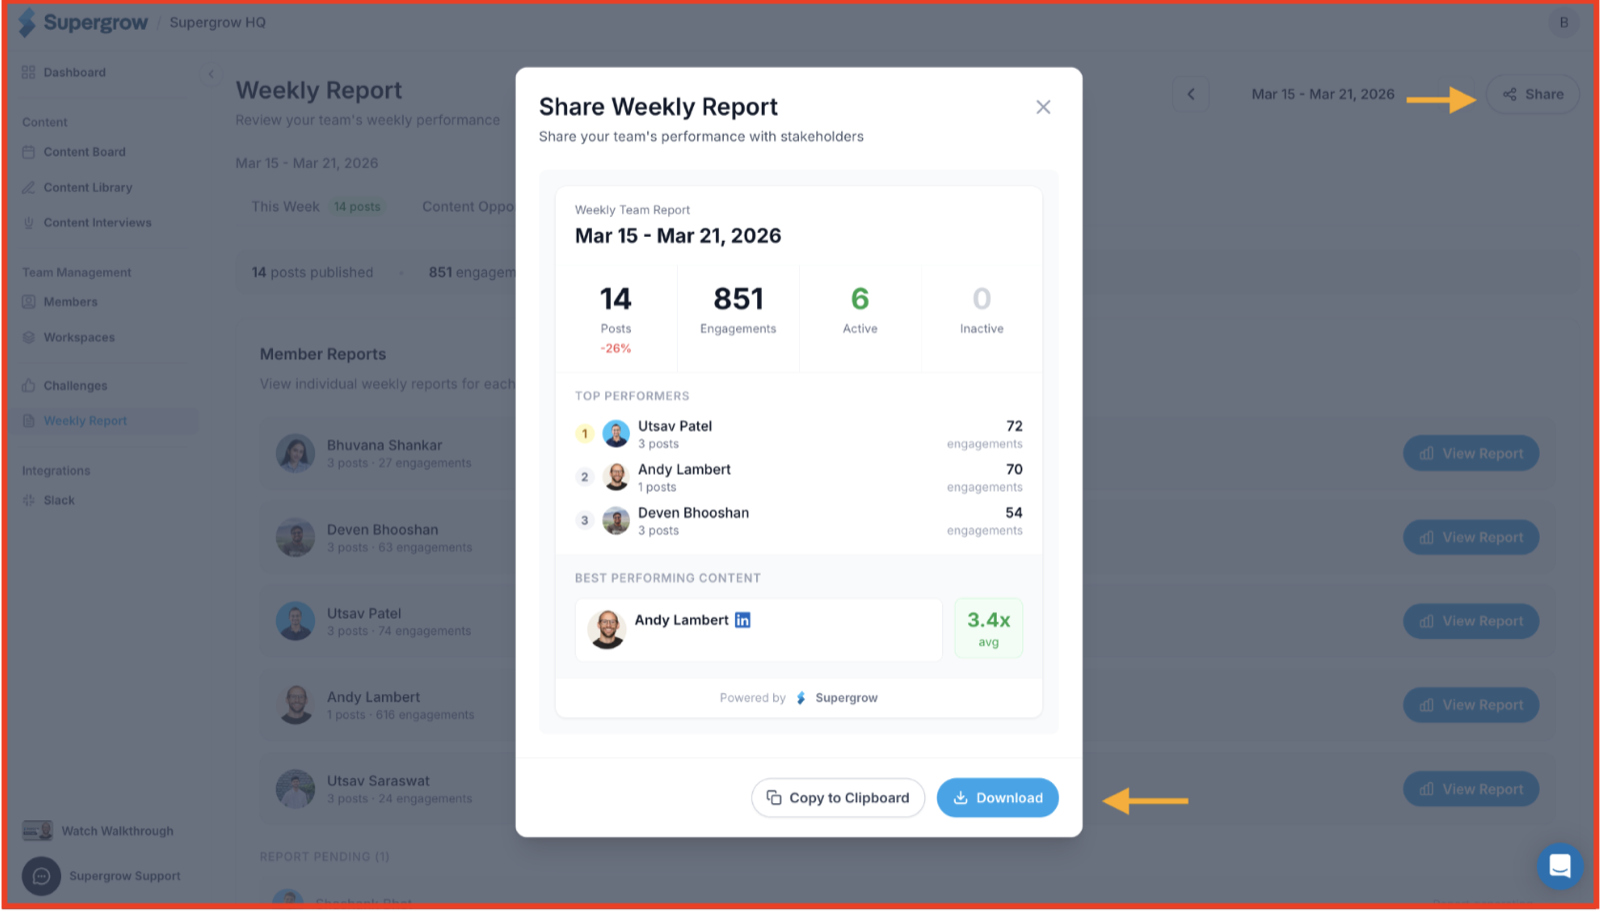
Program managers see exactly who is active, who is slipping, and who has gone quiet before leadership asks.
2. Earned Media Value (EMV)
Every CFO wants a number they can compare against paid media. EMV gives you the dollar equivalent of what your advocacy reach would have cost in LinkedIn ad spend.
How to calculate: (Total impressions ÷ 1,000) × LinkedIn CPM benchmark ($31 industry median)
One caveat worth stating clearly before you take this number into a leadership meeting. EMV is cost avoidance, not revenue. It answers the distribution question only. Present it as one data point in a wider ROI picture, not as the headline number on its own.
Most programs also ignore a calculation gap. Original employee-created posts generate significantly higher engagement than reshared brand content. But EMV formulas price both at the same CPM rate. If your program runs on creation-led advocacy, your real media value is higher than the formula shows.
Storyarb's 14-employee team generated 7 million impressions across a 10-week program. At $31 CPM, that is $217,000 in EMV from a program built entirely around original employee content, not pre-written brand posts.
Supergrow's analytics dashboard automatically tracks EMV. Period EMV, cumulative all-time Total EMV, and a daily EMV vs Impressions trend chart. One click to download or share with leadership.
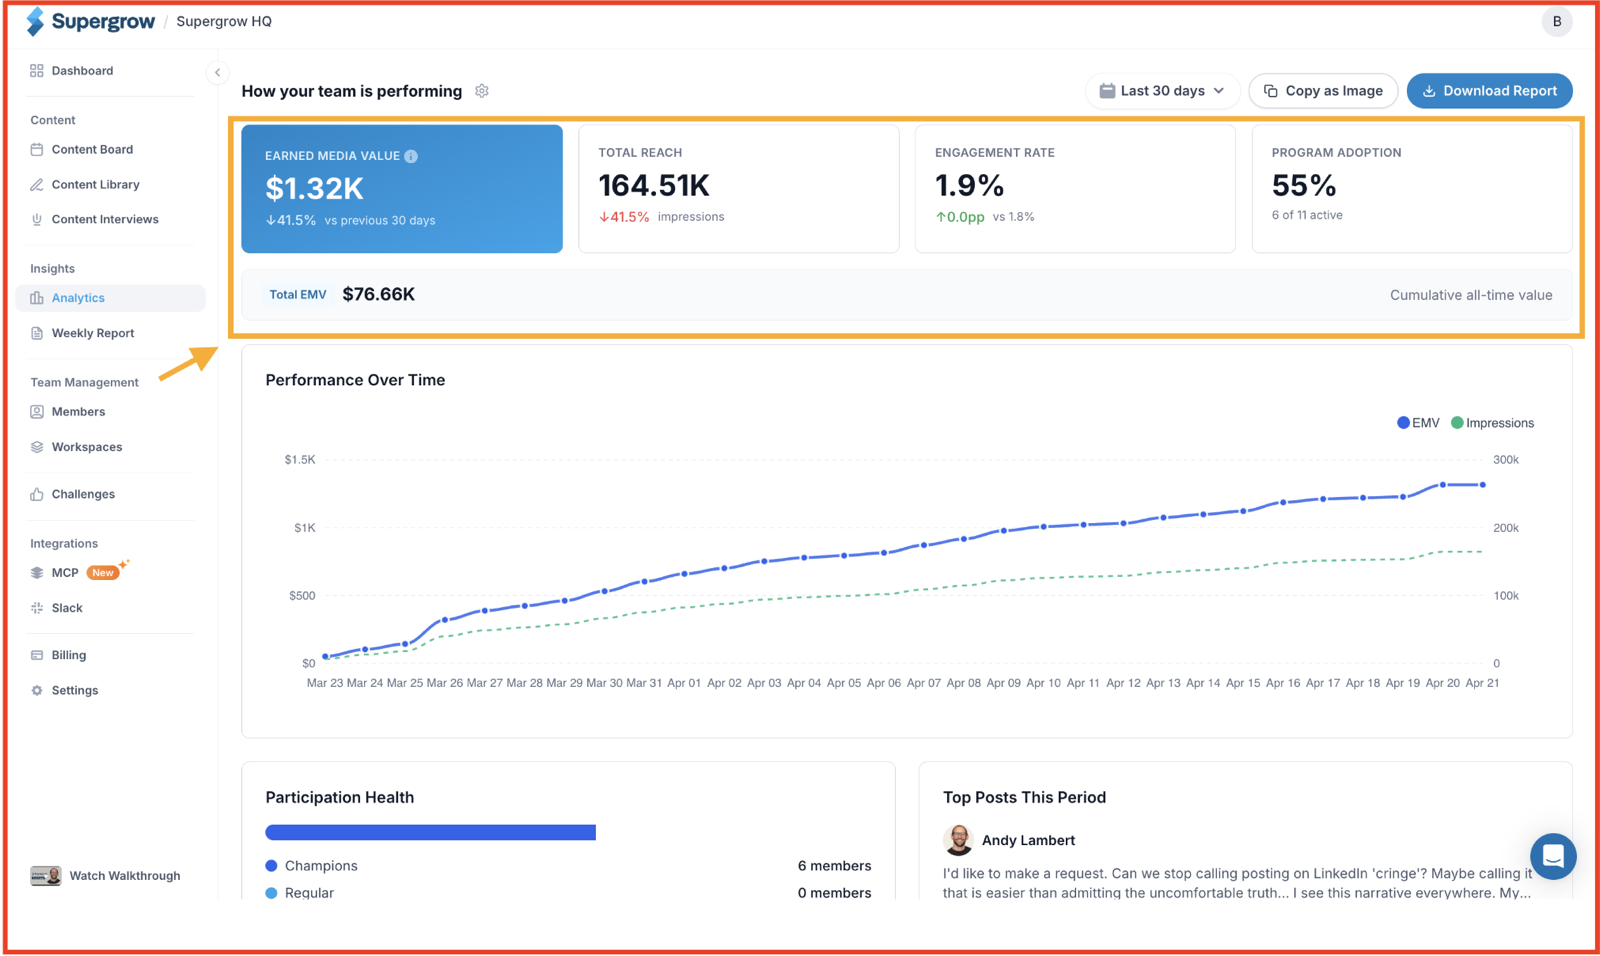
Together, these three cost metrics build the efficiency case. The next three answer the harder question whether your employee advocacy ROI extends beyond reach into pipeline and compounding brand value.
3. Cost Per Click vs Paid LinkedIn Benchmark
This metric lands fastest in a CFO conversation. It translates advocacy performance into a cost-efficiency argument in the language every finance stakeholder speaks.
How to calculate: Total program cost (platform fee + management hours at hourly rate) ÷ total clicks generated from advocacy content
The comparison benchmark is what makes this number defensible.
LinkedIn Ads average $5-8 CPC for B2B in 2026. 23% of advocacy programs achieve under $1 CPC from employee-created content. When your advocacy CPC is $0.80, and your paid LinkedIn CPC is $6.50, that single comparison answers the cost-efficiency question before it is asked.
Track this monthly. Include it as one line in the CFO summary: your CPC vs the LinkedIn Ads benchmark. No slide deck required. No explanation needed. The number speaks for itself.
One important distinction: this metric rewards creation-led programs over distribution-led ones.
Employees who post original content in their own voice consistently generate higher click-through rates than reshared brand posts do. The CPC gap between the two models is measurable — and it compounds every month the program runs on original content.
That is also why teams that invest in a creation-first gamification strategy consistently outperform distribution-led programs in cost per click.
4. Content-Influenced Pipeline
Every other metric tells leadership the program is active. This one tells them it is contributing to revenue.
How to calculate: Pull from CRM every quarter. Deals where an "Employee Advocacy Source" touchpoint appeared before the opportunity was created or advanced. Weight by your attribution model. Even influencing 3-5% of total pipeline at your average deal size produces a number that makes the entire program cost look small.
Most programs cannot report this metric because of the data. The CRM field was never created before launch. Every week without that field is a week of pipeline attribution lost permanently.
L'Oréal launched their global advocacy program across 18 entities with 900 ambassadors and generated a 4x return on investment in 18 months, gaining 33 million organic impressions.
Jean Loh, Global Director of Employee Engagement at L'Oréal, put it directly: "This wasn't about asking everyone to post. It's about employees volunteering to be ambassadors and equipping them with the right tools for success. The program is outperforming expectations, both in reach and impact."
At the SME level, KlientBoost's advocacy program 20x'd their social-influenced pipeline. Social-influenced deals generated $11-15K more in LTV than email- or organic-search-influenced deals.
5. Employee Audience Growth
Employee audience growth shows whether the program is building a compounding asset or just generating activity that resets every quarter.
Every LinkedIn connection an advocate gains is a future organic impression at zero additional cost. A team of 20 advocates each growing their network by 200 connections per quarter adds 4,000 potential impressions per post permanently without increasing the program budget.
How to calculate: Track LinkedIn follower growth per active advocate month over month. Aggregate across the team. Compare the advocate growth rate with that of non-participating employees to isolate the program's contribution.
McKinsey's research found that word of mouth accounts for 20 to 50% of all purchasing decisions. A growing employee audience compounds that reach continuously — at zero additional spend.
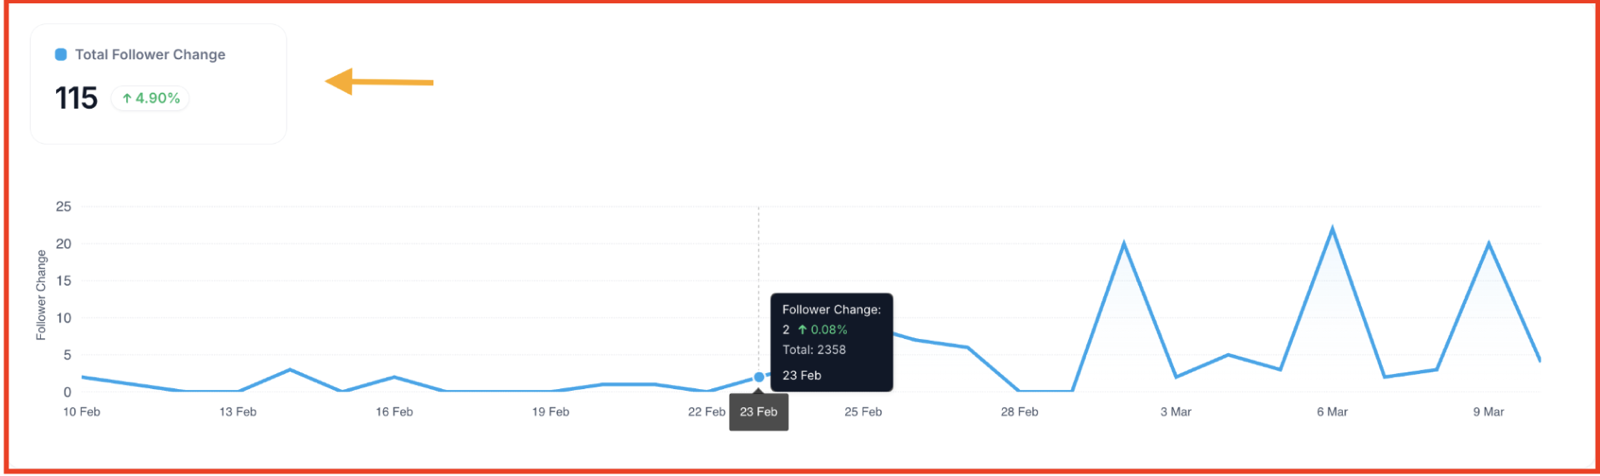
Supergrow automatically tracks follower growth per advocate, per post, and over time, alongside impressions, engagement rate, and profile views. The analytics dashboard shows each metric alongside the previous period, so you can clearly see the compounding trend.
6. Net ROI
Net ROI is the number that makes your employee advocacy program ROI defensible in any leadership conversation. A single figure a CFO can put in a spreadsheet and defend upward.
How to calculate: Net ROI = (EMV + Pipeline Influence Value − Total Program Cost) ÷ Total Program Cost × 100
The total program cost includes three components: the platform fee, management hours at your internal hourly rate, and content creation time. Most teams undercount the management hours, which understates the cost and makes the ROI figure look artificially strong. Use the real number. A defensible ROI is worth more than an impressive one.
Leading programs report that EMV alone exceeds total program costs by 3-5x once fully operational, typically within 6-12 months.
Pulling these six metrics together manually every month is the reason most program managers dread the leadership review.
Supergrow's team analytics dashboard automatically surfaces EMV, participation rate, posting frequency, follower growth, and member-level performance with a one-click PDF export or a shareable live link ready for leadership.
As Kelly Wiarda, Head of Marketing at Grand Ventures, put it: "Before Supergrow, I had no idea which executives were actually posting. Now I can see everything, share it with my CMO, and act on it the same day."
If you are still pulling advocacy metrics manually before every leadership review, there is a faster way. Try Supergrow free for 7 days — no credit card required.
See Supergrow in action and book a demo with our team.
How to Present Employee Advocacy ROI to Leadership
The six metrics give you the data. This section tells you which data goes in which room. Walking into a CMO review with CFO numbers or a CFO review with brand metrics is how program managers lose credibility before the conversation starts.
The CMO Conversation
The CMO wants to see momentum. Not a spreadsheet. Not a list of metrics. A trend.
Lead with participation rate. Is the team showing up consistently week over week? Follow with EMV quarter-over-quarter; is reach compounding?
Close with the top-performing post from the period and one sentence on why it worked. Then show employee audience growth as the long-term signal to prove the program is building something that compounds beyond this quarter.
The CMO wants confidence that the program is moving in the right direction, not a defense of individual numbers.
The CFO Conversation
The CFO wants a single number they can enter into a spreadsheet. Give them the math first, not the context.
Lead with CPC vs the LinkedIn Ads benchmark. One line: your advocacy CPC vs the $5-8 industry average.
Follow with content-influenced pipeline. Deals touched by an advocacy post before converting, pulled directly from the CRM.
Close with net ROI as a single percentage. Program cost in. Program value out. One comparison.
The CFO conversation lives or dies on whether the number is defensible. Which is why the measurement setup from before launch matters more than the presentation itself.
| CMO | CFO | |
|---|---|---|
| Primary question | Is it building pipeline and brand? | What does it cost vs alternatives? |
| Lead metric | Participation rate trend | CPC vs LinkedIn Ads benchmark |
| Revenue metric | Content-influenced pipeline | Net ROI % |
| Trend metric | EMV quarter over quarter | Employee audience growth |
| Presentation format | Visual trend lines, one page | Single number, one comparison |
Build and Measure Advocacy With Supergrow
The shift from manual reporting to automated ROI proof is not a technology problem. It is a setup problem. Program managers who walk into leadership reviews with confidence didn't work harder. They built the right measurement infrastructure before the first post went live.
Supergrow connects your team's LinkedIn advocacy activity to leadership-ready proof. Participation rate, EMV, follower growth, and top post performance are surfaced automatically every week, no manual pull required.
The data your CMO needs and the numbers your CFO wants are already being tracked. You just need the system that surfaces them.
Try Supergrow free for 7 days, no credit card required. See Supergrow in action by booking a demo with our team.